

How to enable KEA traces and dumps: all the options [Kaspersky Endpoint Agent]

Entry posted by svc_kms in How-to
220 views
Kaspersky Endpoint Agent, as many other products, has a few different ways of enabling traces.
Traces folder
NB! The folder specified for traces must exist and be writable. KEA will neither create folder nor display any error if it doesn't exist.
One may choose which is best suitable for their needs:
Traces with restart
In 99% cases, information that is written only during initialization, that is, after KEA restart, is critical for investigation. Unless specified otherwise, always perform KEA restart when collecting traces (after traces are enabled), either by restarting KEA service , via services.msc
In some cases, Kaspersky Support Engineer may ask to perform the restart after the reproduction, in that case, restart KEA not after starting traces, but 2 minutes before stopping traces.

or using CLI:
sc restart soyuz
|
Verification: traces with restart will always contain the lines with the below text:
kata.
codeinjection.rule
|
If the text is nowhere to be found, traces are collected without restart and are of zero to no use, such traces need to be recollected following the procedure.
Using the agent.exe utility
When working with KEA on local host, use cmd or Powershell, started as Administrator, however in some cases KEA installation folder is restricted and requires Local System account to be accessed (one can use Windows Scheduler or, if approved, psexec tool to execute command under Local System).
To enable KEA traces:
C:\Program Files (x86)\Kaspersky Lab\Endpoint Agent>agent.exe --trace enable --folder C:\path\to\folder
|
To disable traces:
C:\Program Files (x86)\Kaspersky Lab\Endpoint Agent>agent.exe --trace disable
|
Modifying registry key
Traces
This option is specifically useful when you have troubles starting KEA service. Modify the registry key:
HKEY_LOCAL_MACHINE\SOFTWARE\Wow6432Node\KasperskyLab\SOYUZ\4.0\Trace\Configuration
|
For your convenience, there's also a registry key with example of Debug configuration next to this one:
HKEY_LOCAL_MACHINE\SOFTWARE\Wow6432Node\KasperskyLab\SOYUZ\4.0\Trace\Configuration(Example)
logging=on;layout=basic;sub-system=*;sink=folder(c:\traces\);level=debug;roll=51200
|
Notice that in this example traces folder is configured to be c:\traces\. As previously mentioned, the folder specified for traces must exist and be writable so if you decide to use this configuration "as is" you need to create c:\traces folder manually.
To disable traces, restore original content of the registry key (logging=off?
HKEY_LOCAL_MACHINE\SOFTWARE\Wow6432Node\KasperskyLab\SOYUZ\4.0\Trace\Configuration
logging=off
|
Dumps
HKEY_LOCAL_MACHINE\SOFTWARE\Wow6432Node\KasperskyLab\SOYUZ\4.0\CrashDump
"Enable"=dword:00000001
"Folder"="c:\\traces\\"
"Enable(Example)"=dword:00000001
"Folder(Example)"="c:\\traces\\"
|
Notice that in this example dump folder is configured to be c:\traces\. This folder must exist and be writable so if you decide to use this configuration "as is" you need to create c:\traces folder manually.
To disable traces, restore original content of the registry key:
HKEY_LOCAL_MACHINE\SOFTWARE\Wow6432Node\KasperskyLab\SOYUZ\4.0\CrashDump
"Enable"=dword:00000000
|
Using KSC console
Enabling traces and dumps
Execute the following steps:
-
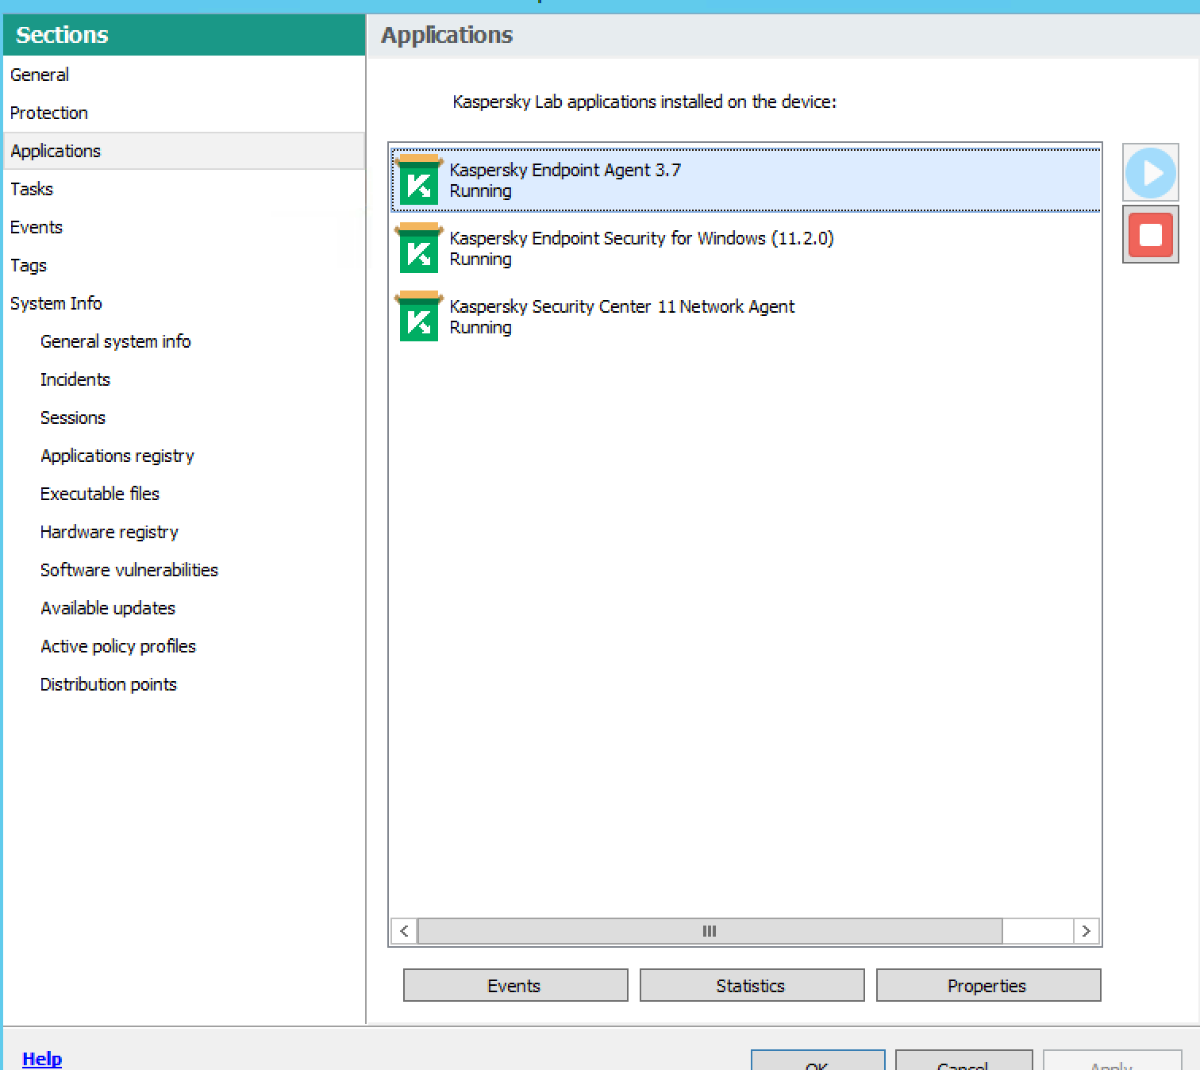
In the properties of target host in KSC console, locate Endpoint Agent app

-
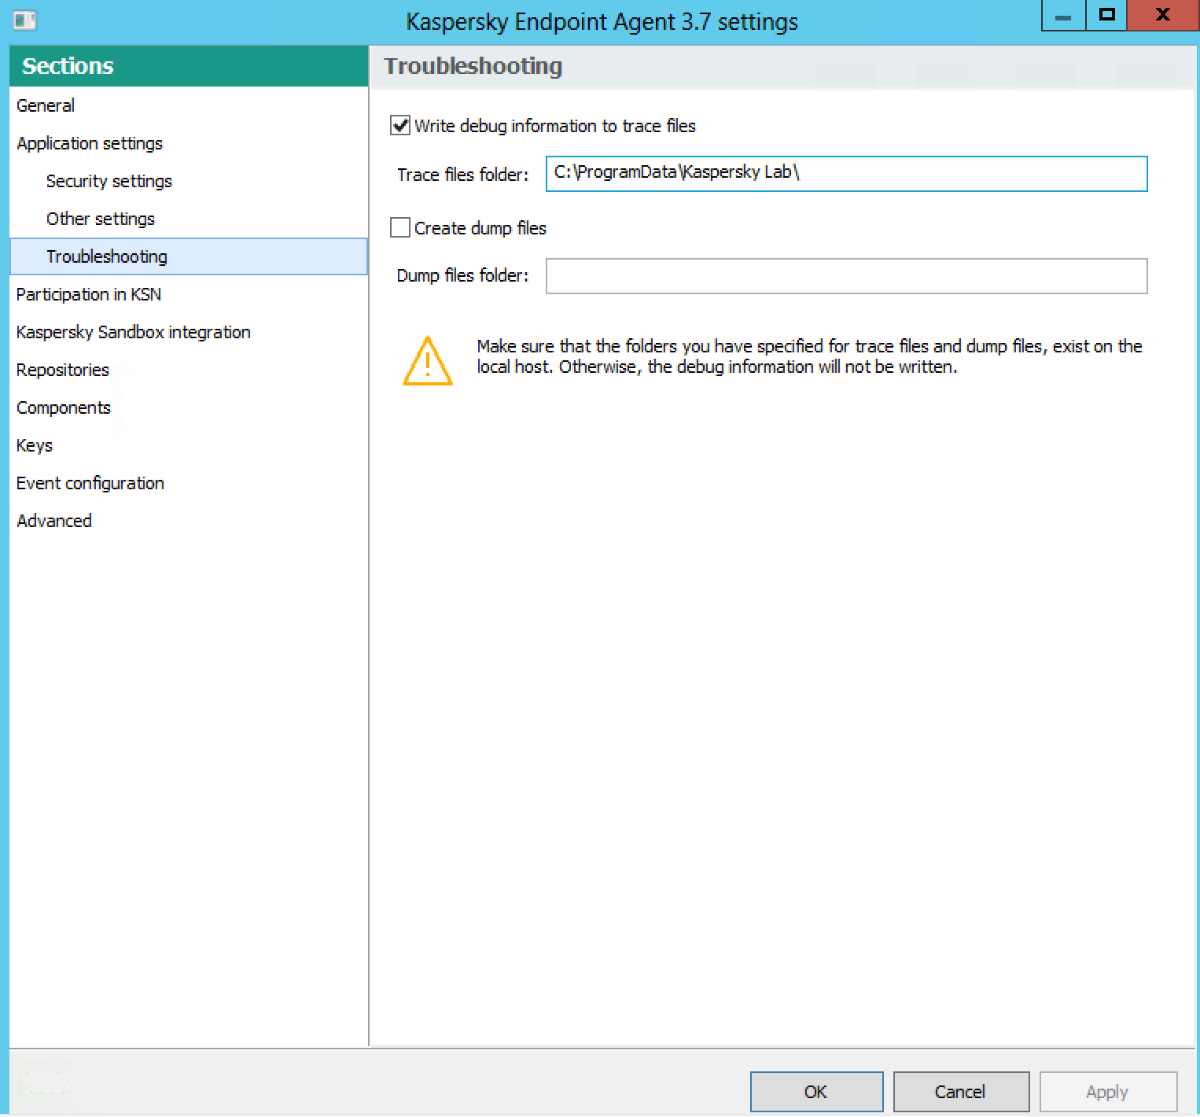
Open Properties of Endpoint Agent, and navigate to Troubleshooting tab and enable traces and dumps(if needed).
NB! It's recommended to write traces toC:\ProgramData\Kaspersky Lab\folder!
To be able to retrieve the traces using Remote Diagnostics Utility configure the traces folder to be the same as respective EPP traces folder, e.g.:
For KES %ProgramData%\Kaspersky Lab\KES\Traces
For KSWS %programfiles(x86)%\Kaspersky Lab\Kaspersky Security for Windows Server\~TraceFiles
Retrieving traces
To download files remotely, execute the following steps:
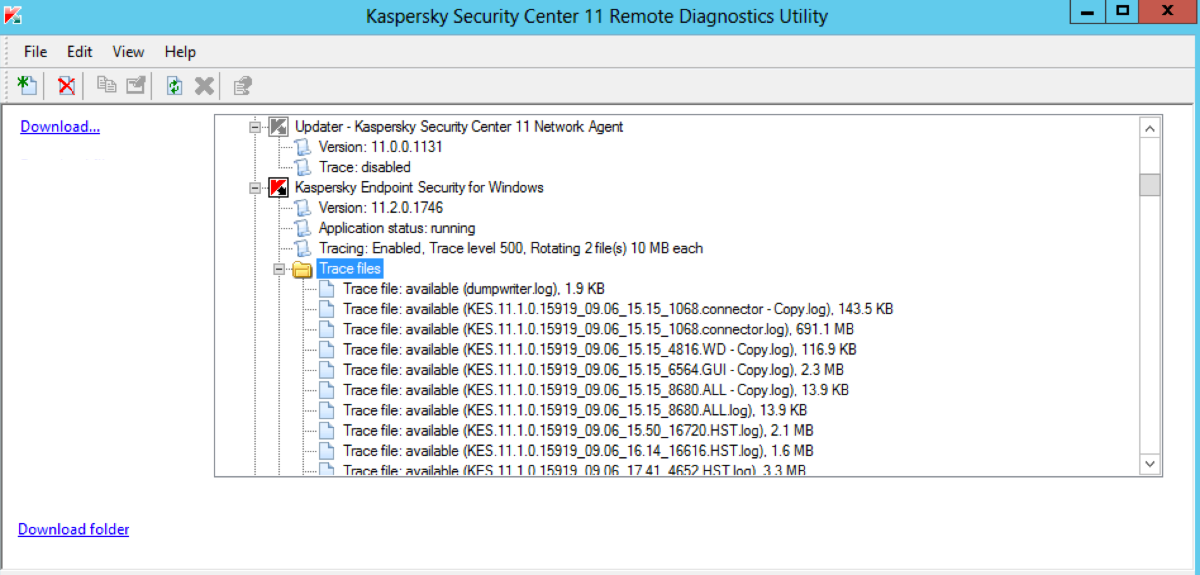
- Connect to target host with Remote Diagnostics Utility
-
Navigate to KES Trace files folder:
-
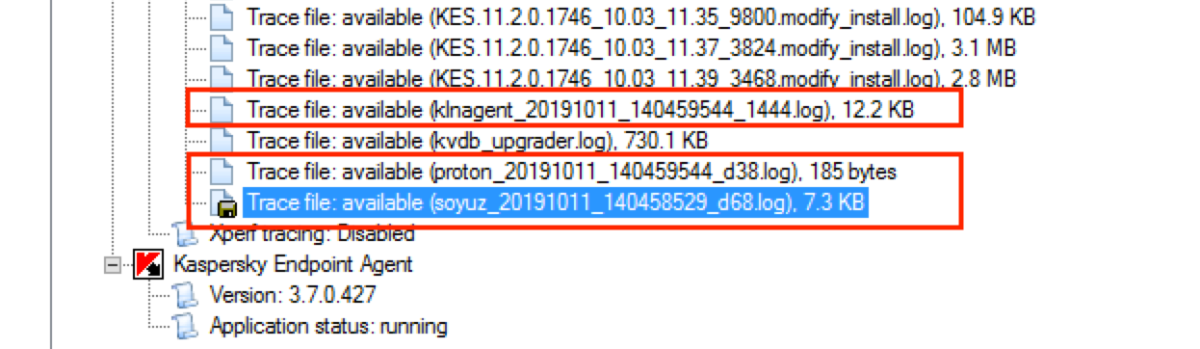
Locate
soyuz_*.log, proton_*.log, klnagent_*.log- these are Endpoint Agent trace files:
- Download these files using the 'Download' button.


0 Comments
Recommended Comments
There are no comments to display.
Please sign in to comment
You will be able to leave a comment after signing in
Sign In Now